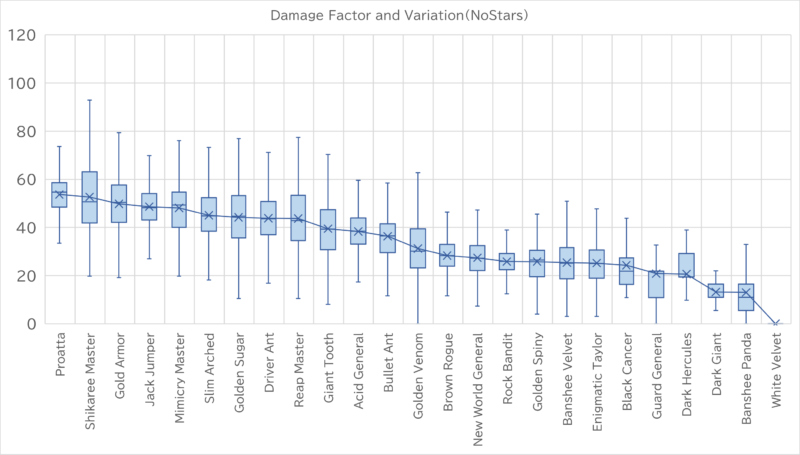
Last time, I calculated the average damage done in 8 turns as the “damage factor”, then ranked the strength of the special ants. However, we know from experience that damage can vary greatly from the average. This time, I took the variation in damage into account and looked at the special ants with the highest firepower.
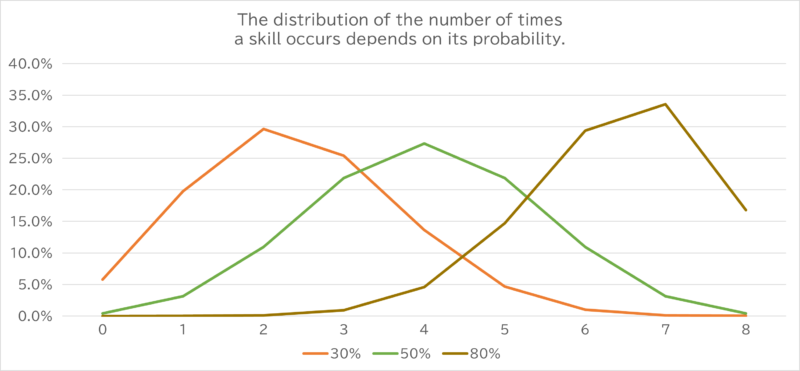
Number of times a skill occurs in 1000 experiments
When the probability of a skill occurring is 50%, the variation in the number of occurrences will be normally distributed, but when it is not, it will not be normally distributed. The standard deviation is not very useful if the probability distribution is not normal, so it cannot be found by a simple calculation.
Actually, someone in the official disco community are thinking about the same thing, and I saw this image. Yes, I want to make a graph like this. However, the subsequent discussion on how this graph was made is not very engaging and not very credible. I’ll have to try it myself.
Using “python”, I set the probability of a skill occurring from 0 to 8 times, and tested each skill 1000 times to see how many times it would occur.
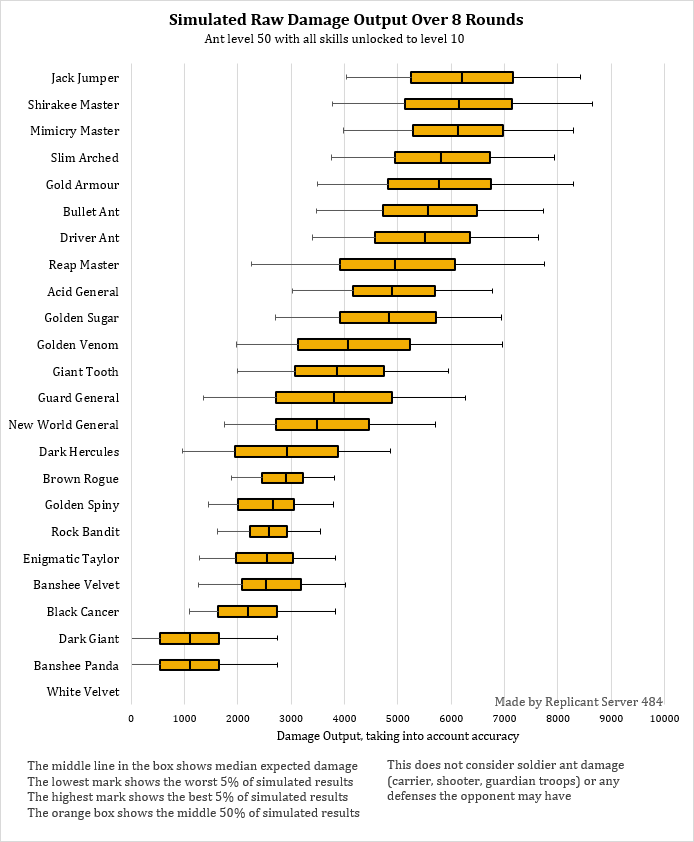
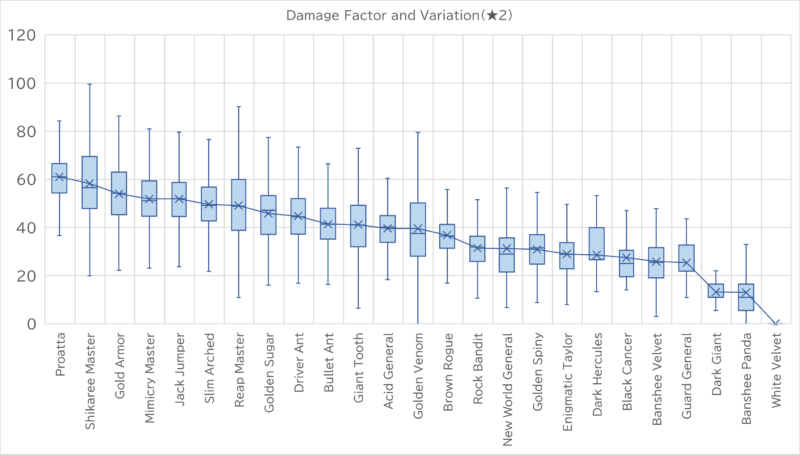
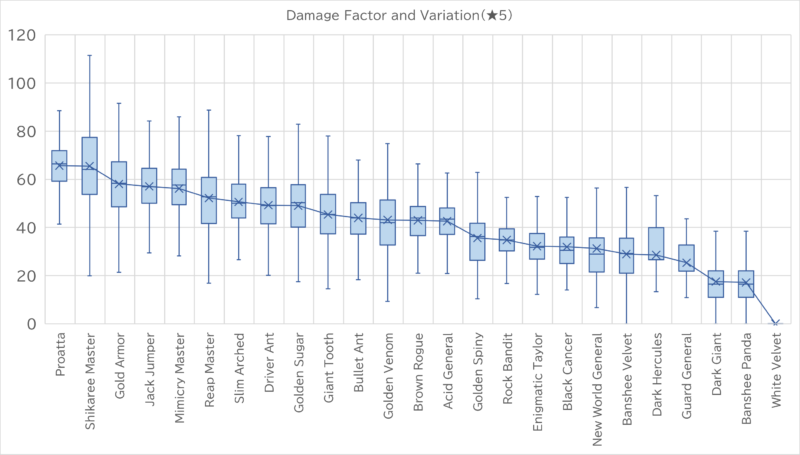
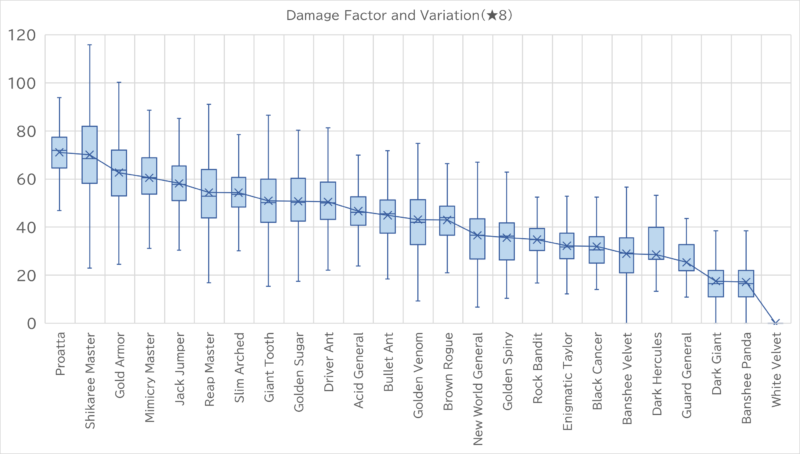
Using a total of 1000 patterns of damage coefficients, I graphed the average damage and variance of each special ant.
How to read a box-and-whisker diagram
- From the bottom of the line to the bottom of the box represents the lower 25%.
- The box represents the middle 50%.
- From the top of the box to the top of the line represents the top 25%.
- The line in the box represents the median.” ×” represents the average.
- Shorter boxes and lines indicate less variability.
Graph of Damage Factor and Variation
NoStars
★2
★5
★8
コメント